Info
| Explore |
Work on this next! What do we know about plants from our experiences outside of school? What have we discovered in class and background research? What questions about plants interest us? |
|---|---|
| Research Question | How will discrete and continuous phenotypic traits(Color, height, and Number of leaves) vary based on the differing fertilizer treatments? |
| Predictions | We predict that the height and number of leaves(continuous traits) will vary depending on the amount of fertilizer. The plants should be taller and have more leaves if they have more fertilizer. We also are predicting that the color will stay the same despite the differing amount of fertilizer. ... |
| Experimental Design | At least once a week we will measure the height, number of leaves, stem color, and the leaf color. Height will be measured in millimeters with a ruler, and will be measured from the very bottom to the very top. The number of leaves is simple because it can be counted. Stem color is either purple... |
| Conclusion | From the data we have collected, it seems that the plants with more fertilizer had more leaves than their lesser fertilized counterparts. the plants with more fertilizer also seem to have more yellow leaves. However, the plants with less fertilizer are, on average, taller than the others. the... |
| About this Project |
Along with their class, the team not only collected data but also reported their results after statistical analysis. They did a great job of communicating their results and analysis both visually and verbally. Although the data may not have supported their hypotheses, they came up with sound... |
Updates
Looks like you are in the final stages of your projects.
It’s great to see that teams from your school are wrapping up and posting conclusions. Enjoy the final stages of your project, and feel free to post any final comments or questions you have for your mentors.
You have until Tuesday, April 25, 2021, for final posts to be added, so please be sure to thank your fellow teammates soon!
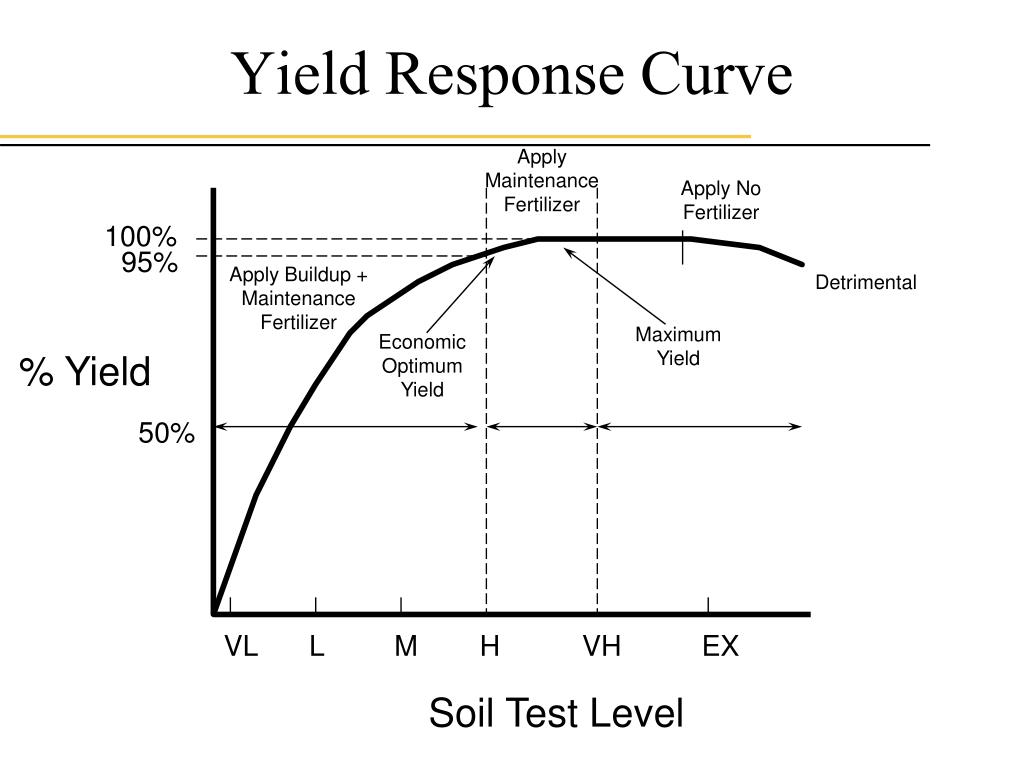
Thanks so much for sharing your results! Your data may not have supported your prediction, but I think you have reason to believe that, in other circumstances, you could find supportive data. I will leave you with this image of a typical yield response curve as you reflect on your experiment. It might have a few extra details, but pay attention to the x- axis of soil nutrient level (very low, low, medium, etc.) and the the y-axis, yield (which is very closely related to growth). Think about where your experimental treatments might have landed on this curve and where you might want them to be to see the greatest difference in your results.
I have enjoyed being your mentor and wish you the best on luck with the rest of the school year!
https://image1.slideserve.com/3562277/yield-response-curve-l.jpg

We found out that there is no significant difference between the discrete traits, and that our prediction was incorrect that the height and number of leaves are both bigger with the low fertilizer group then the high fertilizer group. Thank you
After all of our data analysis, we have not found any significant difference in any of our data. Our standard Deviation tests have proved that there is too much variance to draw any significant conclusions. Thank you so much for all the help you have given us for our project, it is greatly appreciated. We have learned a lot from this project, and we thank you for your help.
It looks like the problem is resolved and everything should be back to normal. Please feel free to resume posting, and do let us know if you experience any issues posting to your projects.
Hello everyone!
We are aware of some technical issues with the platform, leading to an issue with posting to project pages and issues with users' dashboards. We are working diligently with our developer to resolve them as quickly as possible. Please be patient and keep checking your projects so you can post your hellos, updates, reports, thank-yous, and goodbyes.
Yesterday during class we graphed the number of leaves on a white board. we came to the conclusion that the error bars are overlapping which means there is no significant difference. We thought that might be because some of the plants died so there was no data for some plants, and there was different amounts of data from the high and low because of the plants not getting enough water and dying
When you lose data, statistical analysis can still give you results, but you are correct that your error bars are hurt (and increase in size) when you lose data. Do you know why this is?
It seems like watering may also have had an impact on your experiment. Water is an important limiting factor in agriculture, along with nutrient levels. This means that if some plants weren't getting enough water, their lack of growth or leaves may be attributed to not having enough water rather than not getting enough nutrients. We call this the law of the minimum, because growth is not determined by the total resources the plant has (nutrients, water, sunlight etc.) but instead by the most limiting resource.
We have done more standard deviation tests, and we have found the values for all of the trials. from the data collected, we made a graph which included standard error bars. since all of the bars overlapped, we found that there was never any significant difference in the data. One of the things that may have caused this was the plants not receiving enough water, or maybe the reason was because me didn't measure all of the plants, thus limiting our sample size.
These are both good reflective thoughts! Standard error is a calculated value and sample size is definitely an important component. Another important component is your variation. The total variation you see in your data is a sum of several things including random variability, variability from measurement, and the variability from each individual plant (water, sunlight, temperature, individual seed, etc.). We can't control random variation, but we can try as much as possible to reduce the variability of each plant we sample. Did each plant receive the same amount of water, or did you water as needed? Were the plants next to a window? Sometimes overhead lighting can help. Reducing the variation can help to make our experiment more precise.
Of course, there are always limits to what we can do in an experiment. Maybe you don't have a cup to measure water or you don't have an overhead light to try to improve variability among plants. In this case, increasing your sample size is a good method to improve standard error.
Another thought, when you can't reduce standard error or increase precision, is to change the difference you are trying to detect. For example, I might design an experiment to measure people's heart rate. I design my treatments as people sitting versus people standing. I expect that people standing will have a higher heart rate, but when I finish the experiment I realize that with my tools, I see no significant difference. I redesign my experiment to test heart rate between a sitting group and a group of people doing jumping jacks. Now, with the same tools and even the same standard error, I find a significant difference because the difference in heart rates between the two treatments is much greater. Can you think of how you could change your plant treatments to improve the chances that you will detect a difference between groups?
These are great results that we can learn a lot from, whether they are significant or not! Since this data is from the first day of measurement, it may be the case that height at this point in time does not differ much. When plants are young, their source of nutrients may be more reliant on what was contained in the seed rather than the soil, since have not grown a large root system yet to extract nutrients. The difference between fertilizer/no fertilizer treatments may become more prominent as more time elapses. It might also be the case that your experiment was not precise enough to measure the difference after considering all experimental sources of variation, but let's talk about that after we see the rest of the results!
In class today we worked on finding the standard deviation and standard error for a practice data set of the height for one time period. We found out that the standard error was about 3 and the standard deviation was 6.8. Next we will find the rest of the standard errors and standard deviations for the rest of the data.
this type of standard deviation and standard error can be done for the height and number of leaves, but not for the color because the color isn't a numerical value
I have uploaded the data of the standard deviation to the project. here we have calculated the mean, variance, standard deviation, and standard error of the low fertilizer group on the first day. from this as well as the mean of the high fertilizer group height on the first day we measured, we have found that the results are not statistically significant. the low fertilizer group's mean was 32, and the high fertilizer group's mean was 30.1. the standard error was 1.61, and so 32- 3.22 =28.78. since 30.1>28.78, the results are not statistically significant. we plan to do this kind of analysis for the rest of the data as well.
Interesting that the plants with more fertilizer had more yellow leaves and were shorter on average. Did you or your classmates have any thoughts on why this might be the case?
Love seeing your data! Your teacher said you were also learning about statistics. What have your learned so far that you have/will apply to your experiment?
Did you notice that in your height measurements that some numbers are very low while others are very high compared to the mean? We call this variability. A measurement like 15 or 45 varies, or deviates, a lot from our average, but a measurement like 32 is not far off. As scientists, we would like all of our measurements to be close to the mean because we can be more confident that our results are closer to the true mean (or the mean we would get it we did this experiment 1000 times), but that doesn't always happen!
Thank you for your feedback from the 15th. We will try to add more detail to our experimental design to make it more detailed. On Tuesday we collected data on our plants and then we stuck bees with toothpicks and rubbed pollen on the bees abdomen. We then rubbed the pollen from the bees on different flowers to cross-pollinate each flower. On Thursday we collected data and went through the graphs we made for the data on Tuesday. We found out that the high fertilized plants height was smaller than the low fertilized plants. We also found out that more plants with low fertilizer stem color were purple and for high fertilizer it was green. Next we plan to keep collecting data and see if there are any changes.
This looks good, however it couldn't hurt to add a few more details to your experimental design. Imagine that someone was going to repeat your experiment just from reading it. At what plant age do you start your measurements? How many weeks does your experiment last? And so on...
It would be great if you could add on to your rationale as well.
It is great that you are starting to notice some differences! Still continue to try to think of the reasoning behind both your predictions and the results you are seeing. Why would fertilizer lead to a plant with more leaves or a different color?
You are correct in thinking that sometimes results are do to coincidence or other factors, rather than our treatment. This is part of the importance of experimental design. It is certainly true that increasing the number of plants would increase our confidence in the results, but there are other things, too, that you as a scientist can do to build a good experiment. For example, you can randomize all of your plants and treatments within a certain area. This can help ensure that the plants clumped together in the corner are growing more leaves due to fertilizer rather than more sunlight from the window or a higher temperature from the heater.
As you move forward, think a little bit more about why you think fertilizer rates might influence continuous traits. If you didn't test fertilizer, what other factors might be influential? Think about all this things that make you feel different from day to day. What environmental factors related to where they are and what is happening around them might effect a plant?
I drove out to Napa Valley this weekend which is known as wine country out here in California. It reminded me of your projects because the the vineyards are blooming yellow this time of year with Brassica rapa. It turns out that vineyards often plant mustard seeds in between the vines to cover the soil during the winter time. The mustard plants are rich in nitrogen so they also double as natural fertilizer when they are tilled back into the soil!
Hi, we have learned about discrete traits which are chosen by one gene and continuous traits which are chosen by many. In a brassica rapa plant, color is a discrete trait and size is a continuous trait. We think that the discrete traits won't vary very much because of the environment. For the continuous traits we think there will be a difference. We will investigate this claim by having a number of plants with different amount of fertilizer. We will also measure the color, leaf size, height and number of leaves.
Wow, this seems like a great start! I am excited for you to start your experiment! Feel free to start filling in the project information with with exploratory knowledge and research questions whenever you reach that point.
Hi my name is Kaelyn, and I have a twin sister. I was wondering why you chose the experiment you are doing on rice plants?
Hi Kaelyn! Is your sister identical or fraternal?
Researching rice happened to fit in well with my previous experiences. I have done research in wetland soils near the Chesapeake Bay and had also completed some work in South Asia. Rice grows in man-made wetlands and they grow a lot of it in South Asia! This particular experiment was of interest to me because it dealt with nitrogen, which is always a hot topic in agriculture. It is the limiting nutrient is most agricultural fields, takes a lot of energy to produce, and can cause pollution when we aren't careful about how we apply it. Normally, we use fossil fuels to capture nitrogen from the air and turn it into a form that is available to plants. But, it turns out that microbes living in rice soils also do this process, called fixation, naturally! Before modern agriculture, this relationship between soil nitrogen fixers and rice plants, helped to sustain rice crops without requiring the addition of fertilizers. I wanted to learn more about the relationship between rice and soil nitrogen fixers and understand how we might apply that knowledge to increase the sustainability of modern rice farming.
Hello, my name is Patrick and I have a golden retriever puppy. Do you think it would be possible to have a fully automatic farm? By this I mean a farm where plants are grown and harvested without any human interference necessary.
Hi Patrick! I certainly think so. Many researchers are working not only to reduce the amount of human labor, but to use automation as a way of maximizing efficiency in a way humans just can't do by themselves. Just imagine if we could constantly monitor the health of each field and each plant to be able to automatically deliver water, fertilizer, or treatment for disease exactly when they need it! But this also means that the skillset required to be a 'farmer' might look a lot different in the future!
Welcome to your PlantingScience project page!
Welcome to this community of plant researchers. As your team plans and conducts your own research project, you will be mentored by a scientist. The mentor's role is to encourage and guide you through the process of scientific discovery. The more you share your ideas and research information online, the more your mentor can help. You can also find out more about your mentor. What is their research about? Why did they go into science? What do they like to do when they are not working?
You may also hear from this classroom’s assigned scientist liaison. Liaisons work with several mentors and help make sure the conversations are going strong. They may also offer some extra advice or encouragement.
Two resources can help you get started:
Best wishes as you start this scientific journey. We are all pleased to share this experience with you. Have fun!
To set up your project page:
- Choose your project team name. Need inspiration? Visit the project gallery to see other student teams.
- Upload a photo or avatar for your team.
- Introduce yourselves to your scientist mentor and get the conversation started!
- PLEASE ONLY CLICK "Share with team" ONCE. Sometimes the page takes a little while to refresh, so please be patient!
- In order to protect student privacy, please DO NOT share:
- last names
- social media handles
- links to Google/Sharepoint documents, spreadsheets, or images